Description
The Socket Statistic module visualize Linux Kernel TCP stack variables. This module provides a nice way to get an idea what happens inside the network stack. This information is quite useful for troubleshooting data transfer, understand TCP behavior and other things as well.
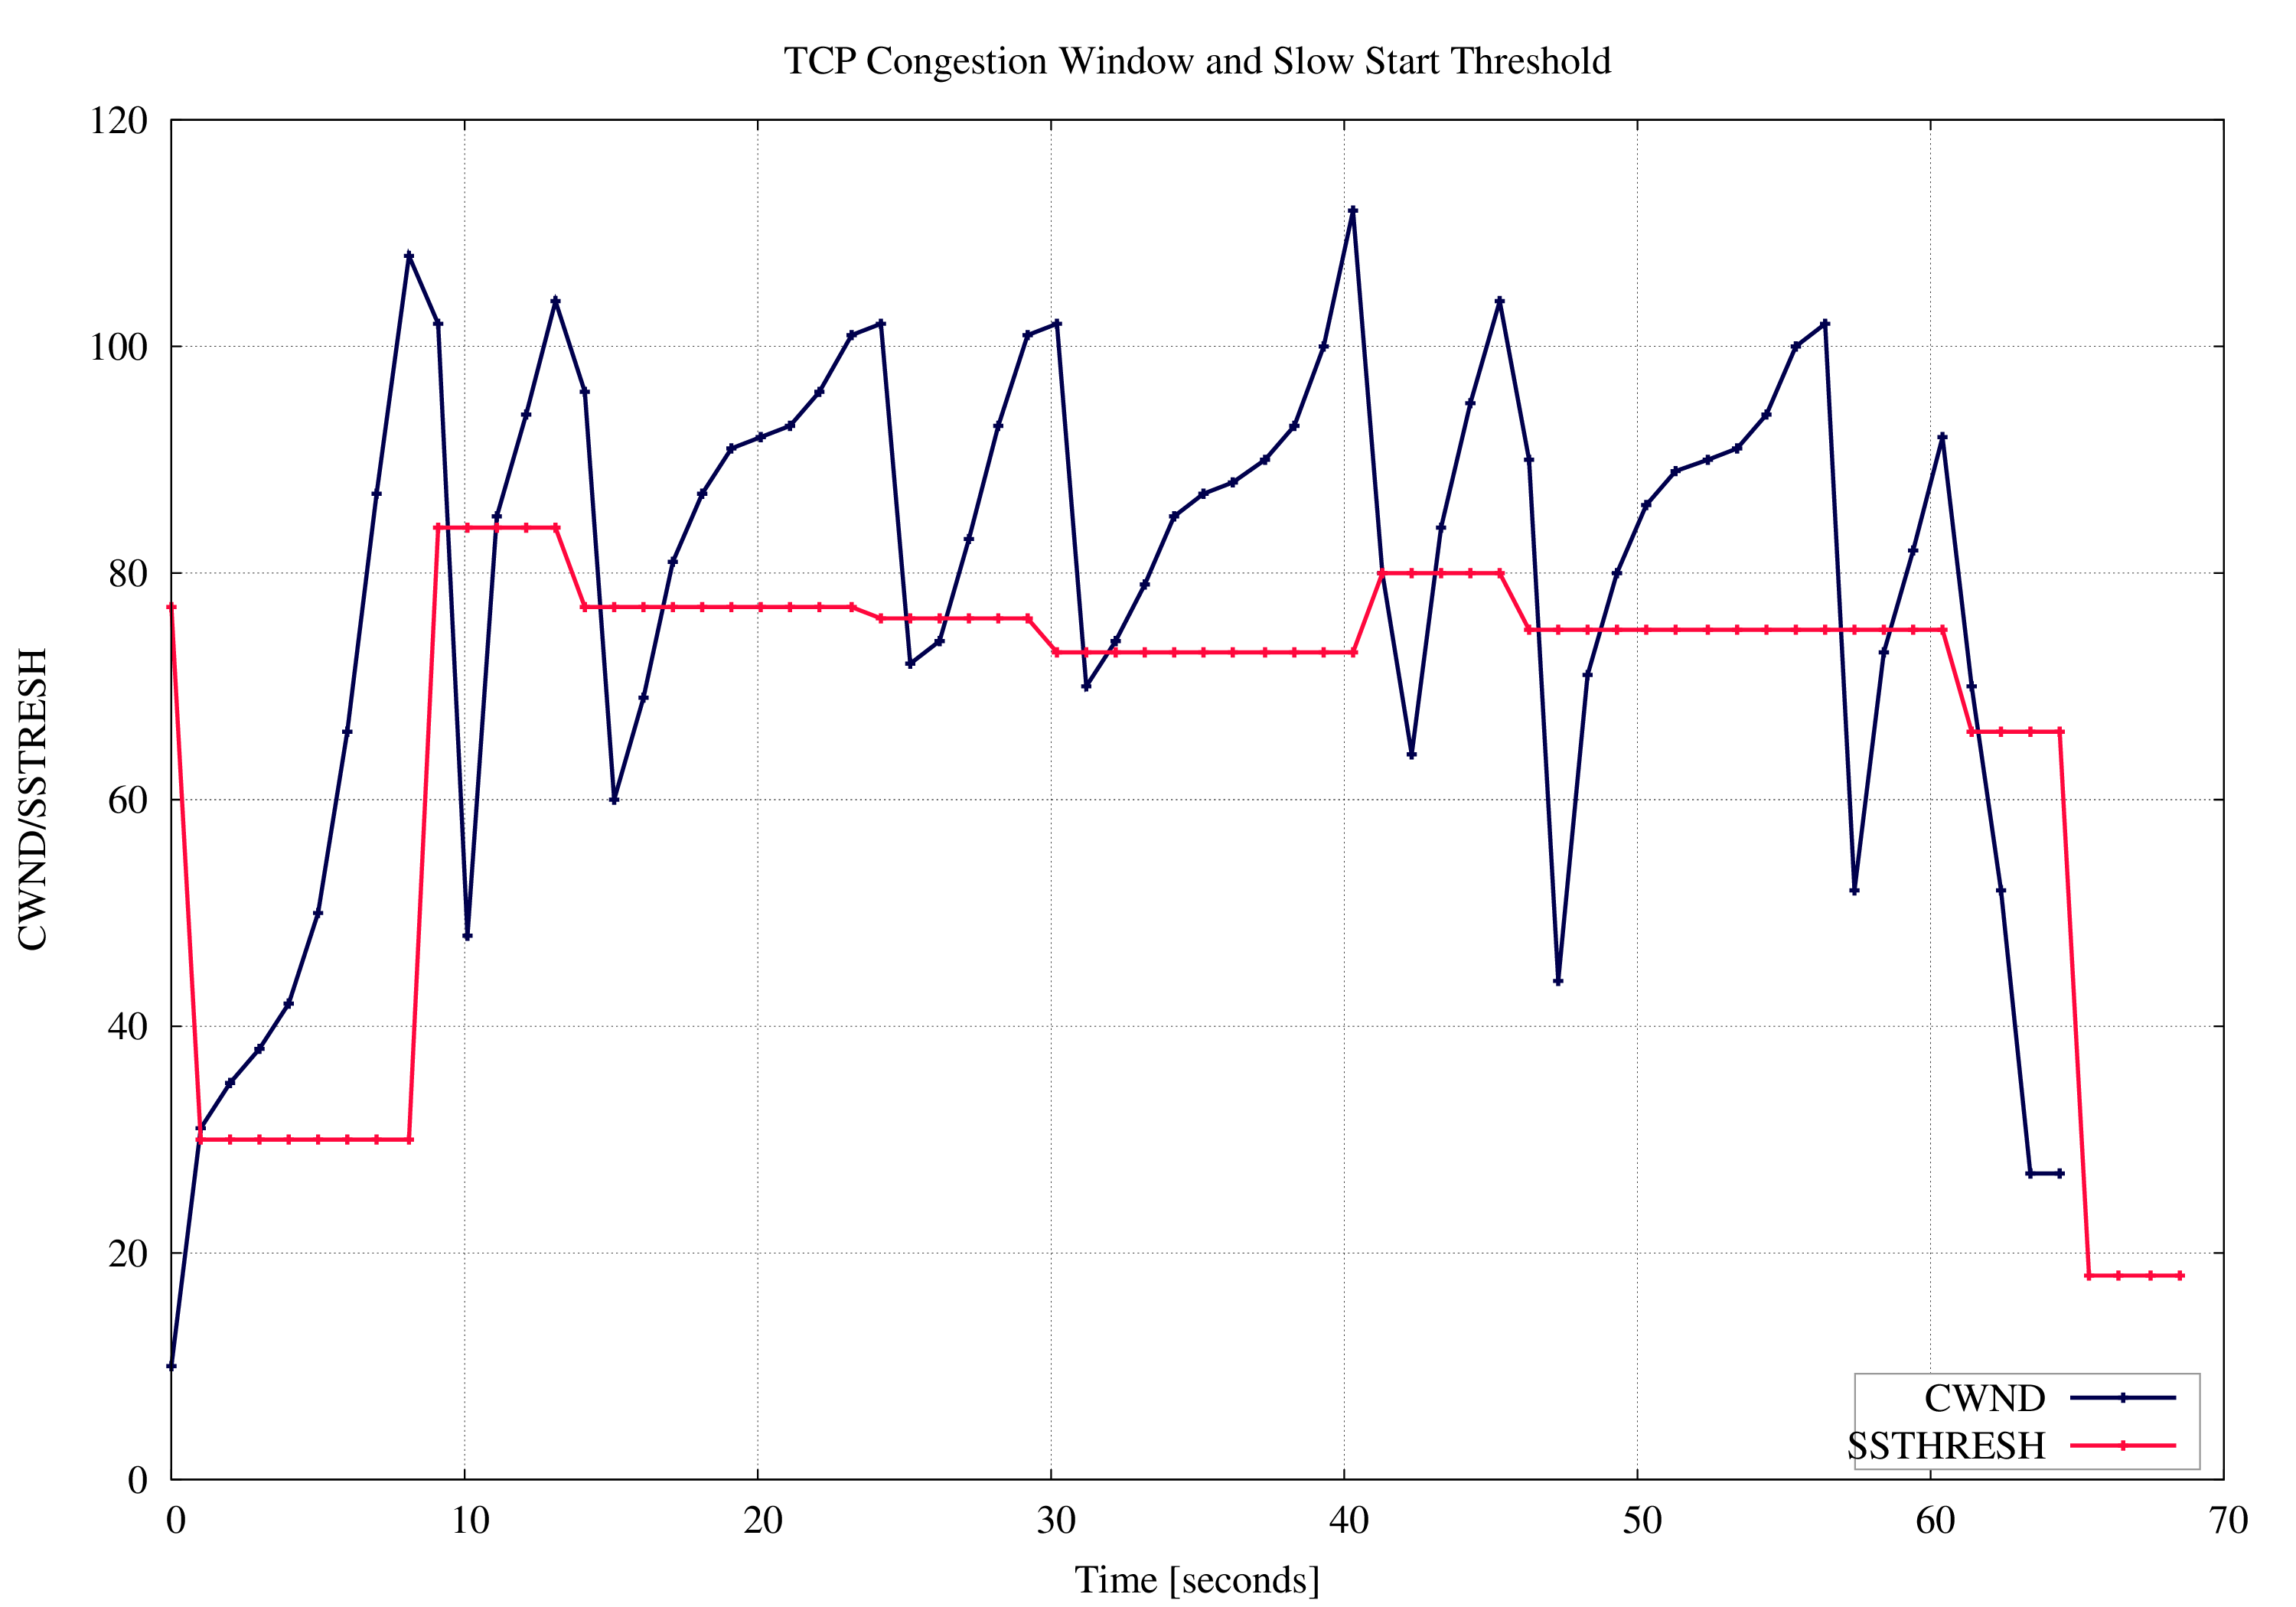
The following image show TCP congestion window and slow start threshold for file transfer of ~7MiB over DSL line (captured at data sender):
This module is one of the rare Captcp modules with no PCAP file argument. Rather this module captures kernel internal data during runtime via ss(8). Thus this module do not work for any operating system beside Linux. For BSD there is probably a way via dtrace to get the same information but this is not implemented.
The socket statistic module works on a sampling basis: each
second (default 1Hz) the data is queried. This means there may
be some steps in between. Especially if the delay between
sender and receiver is low (e.g. datacenter) the sampling may
be to coarse. The sampling rate can be configured via
--sampling-rate N.
The next lines show how to use this module. It is just as easy as other modules:
$ mkdir outputdir
$ captcp socketstatistic -o outputdir
# E.g. START FILETRANSFER
# CRTL-C TO INTERRUPT AND END MEASUREMENT
$ tree -L 2
.
|-- ::1:60653-::1:631
|   |-- cwnd-ssthresh
|   |-- rtt
|   `-- skmem
|-- 192.168.1.29:46066-80.244.247.6:22
|   |-- cwnd-ssthresh
|   |-- rtt
|   `-- skmem
`-- 192.168.1.29:49041-208.68.163.218:5222
    |-- cwnd-ssthresh
    |-- rtt
    `-- skmem
$ cd 192.168.1.29:46066-80.244.247.6:22/cwnd-ssthresh
$ make png
Options
| Short option | Long option | Description |
|---|---|---|
| -o outputdir | --output-dir=outputdir | specify the output directory |
| -h | --help | print this help screen and usage info |
| -s rate | --sampling-rate rate | specify the sampling rate, default is 1Hz. Avoid large values, e.g. larger then 100 Hz! |
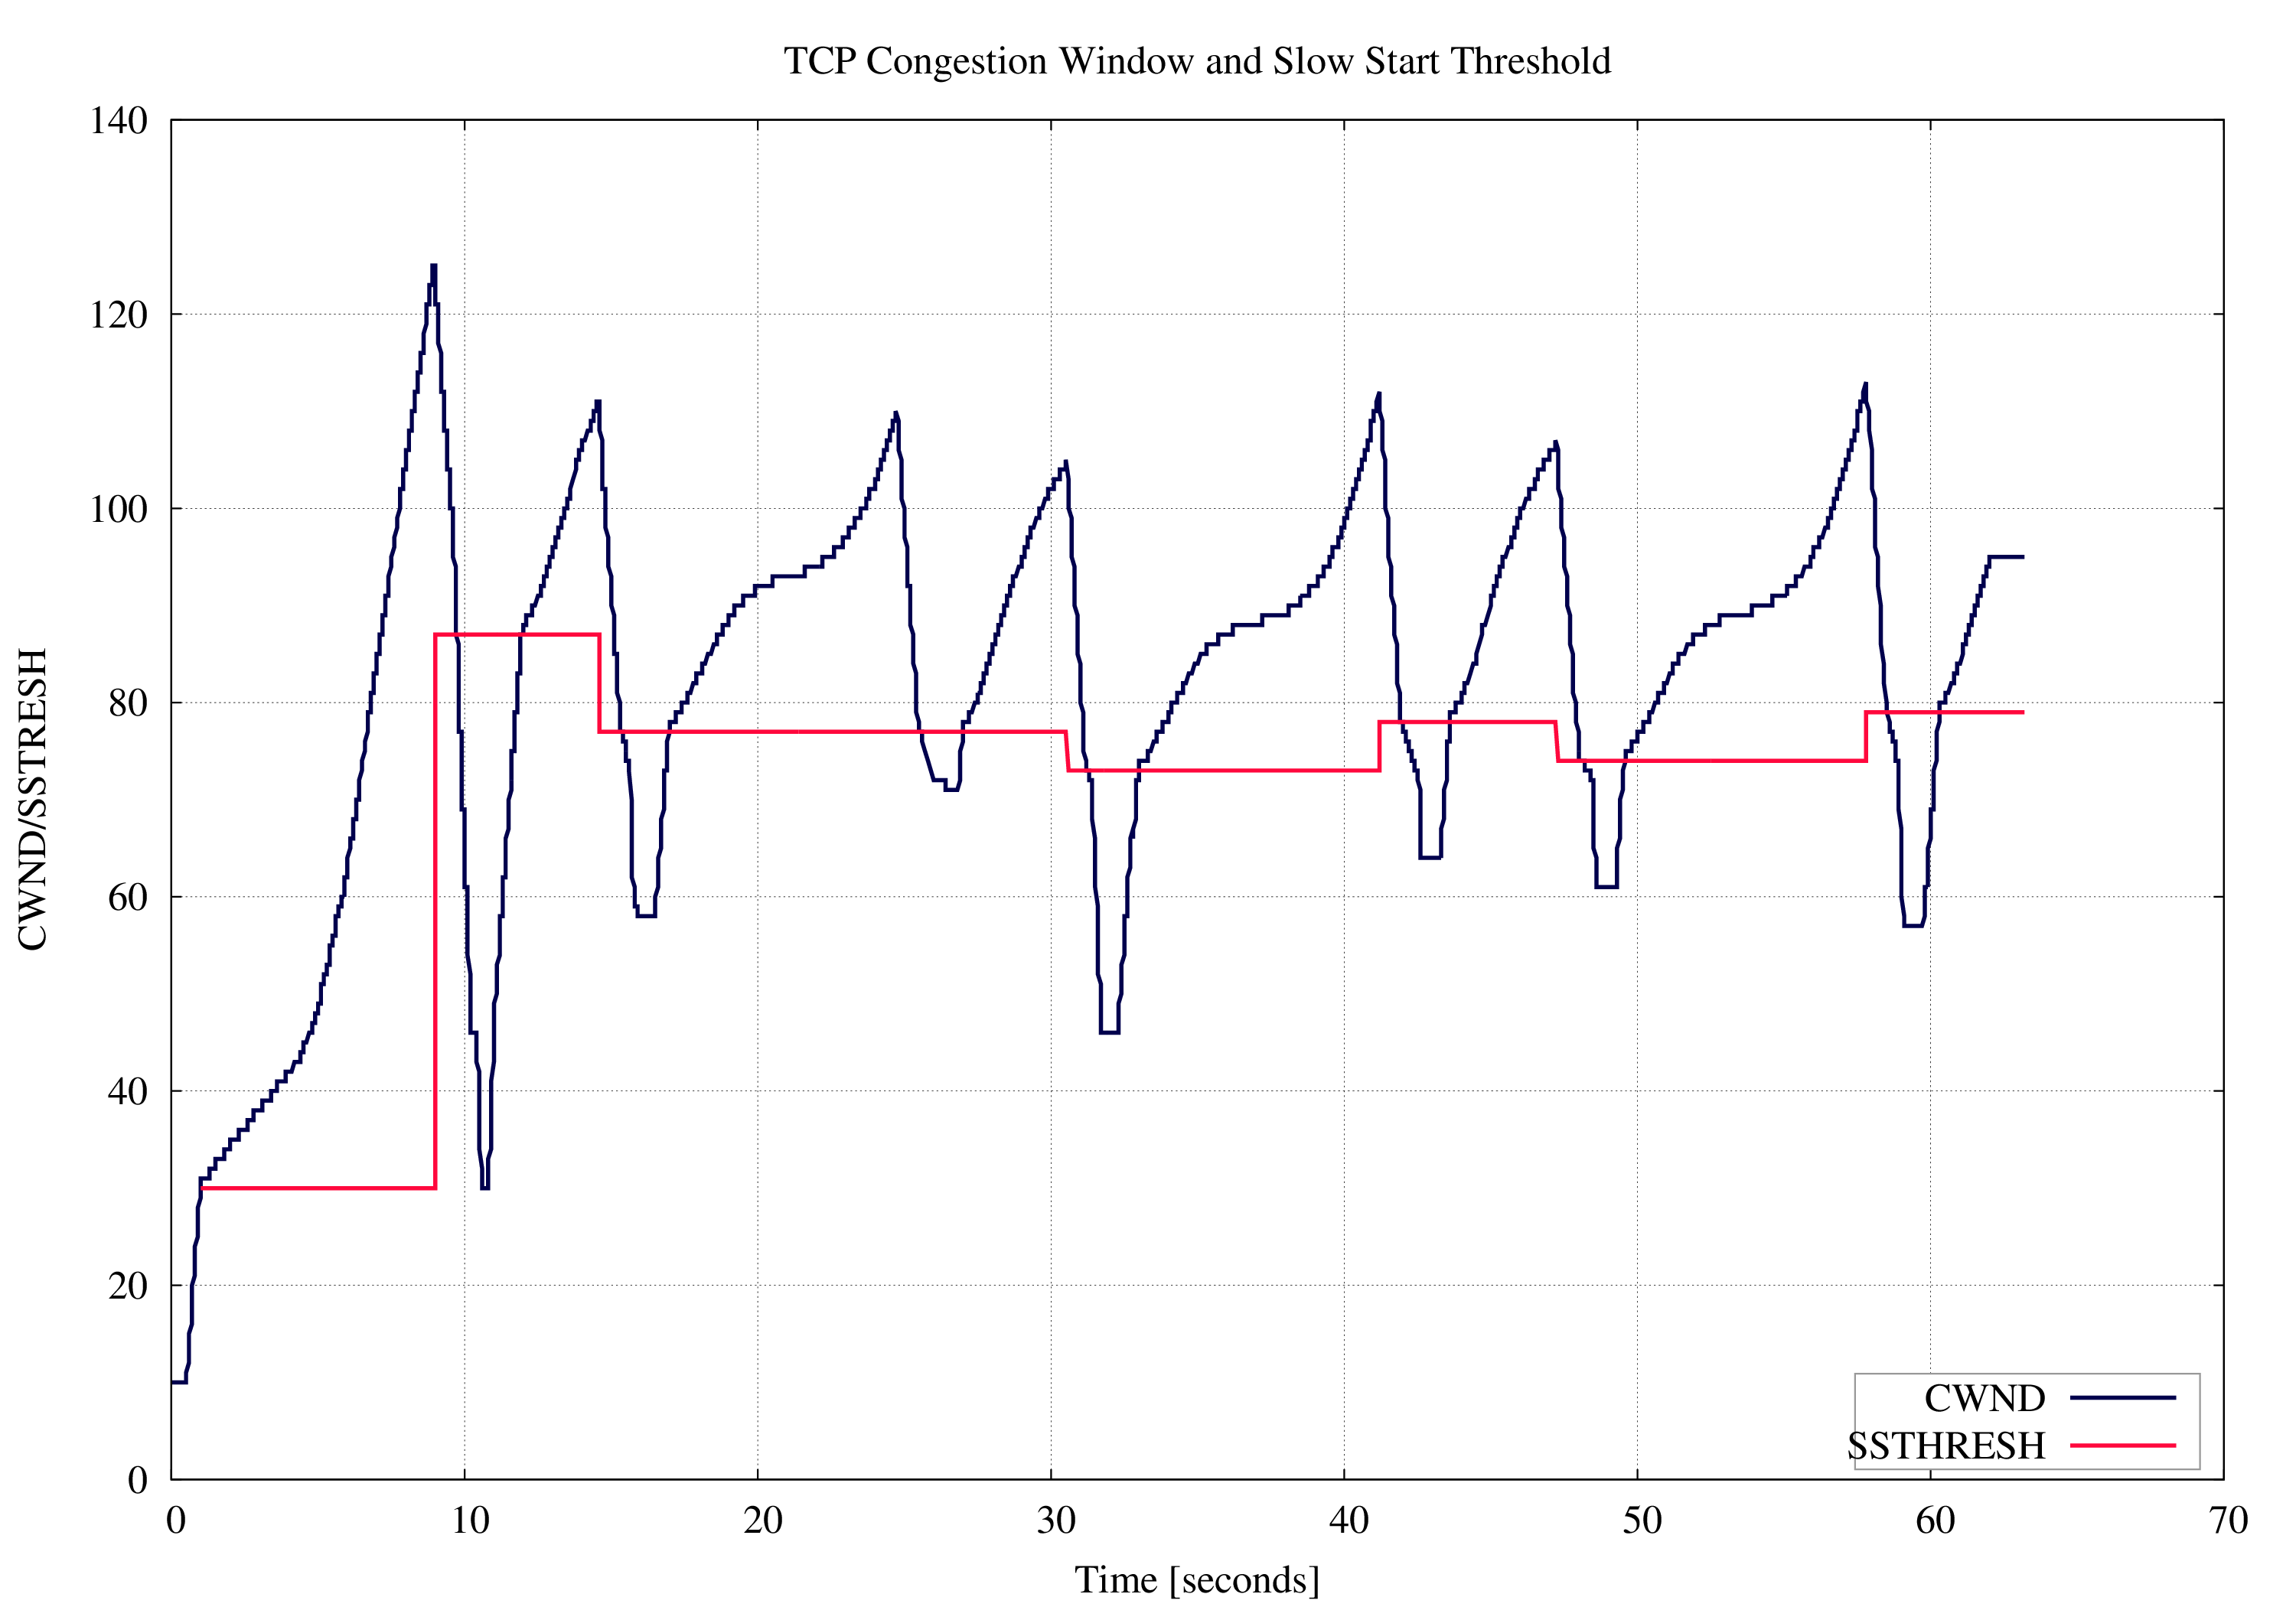
Congestion Window and Slow Start Threshold
The following image illustrate TCP congestion window and slow start threshold behavior. This time captured with a sampling rate of 100Hz. Note quite hard to see that Cubic is used as the congestion control algorithm:
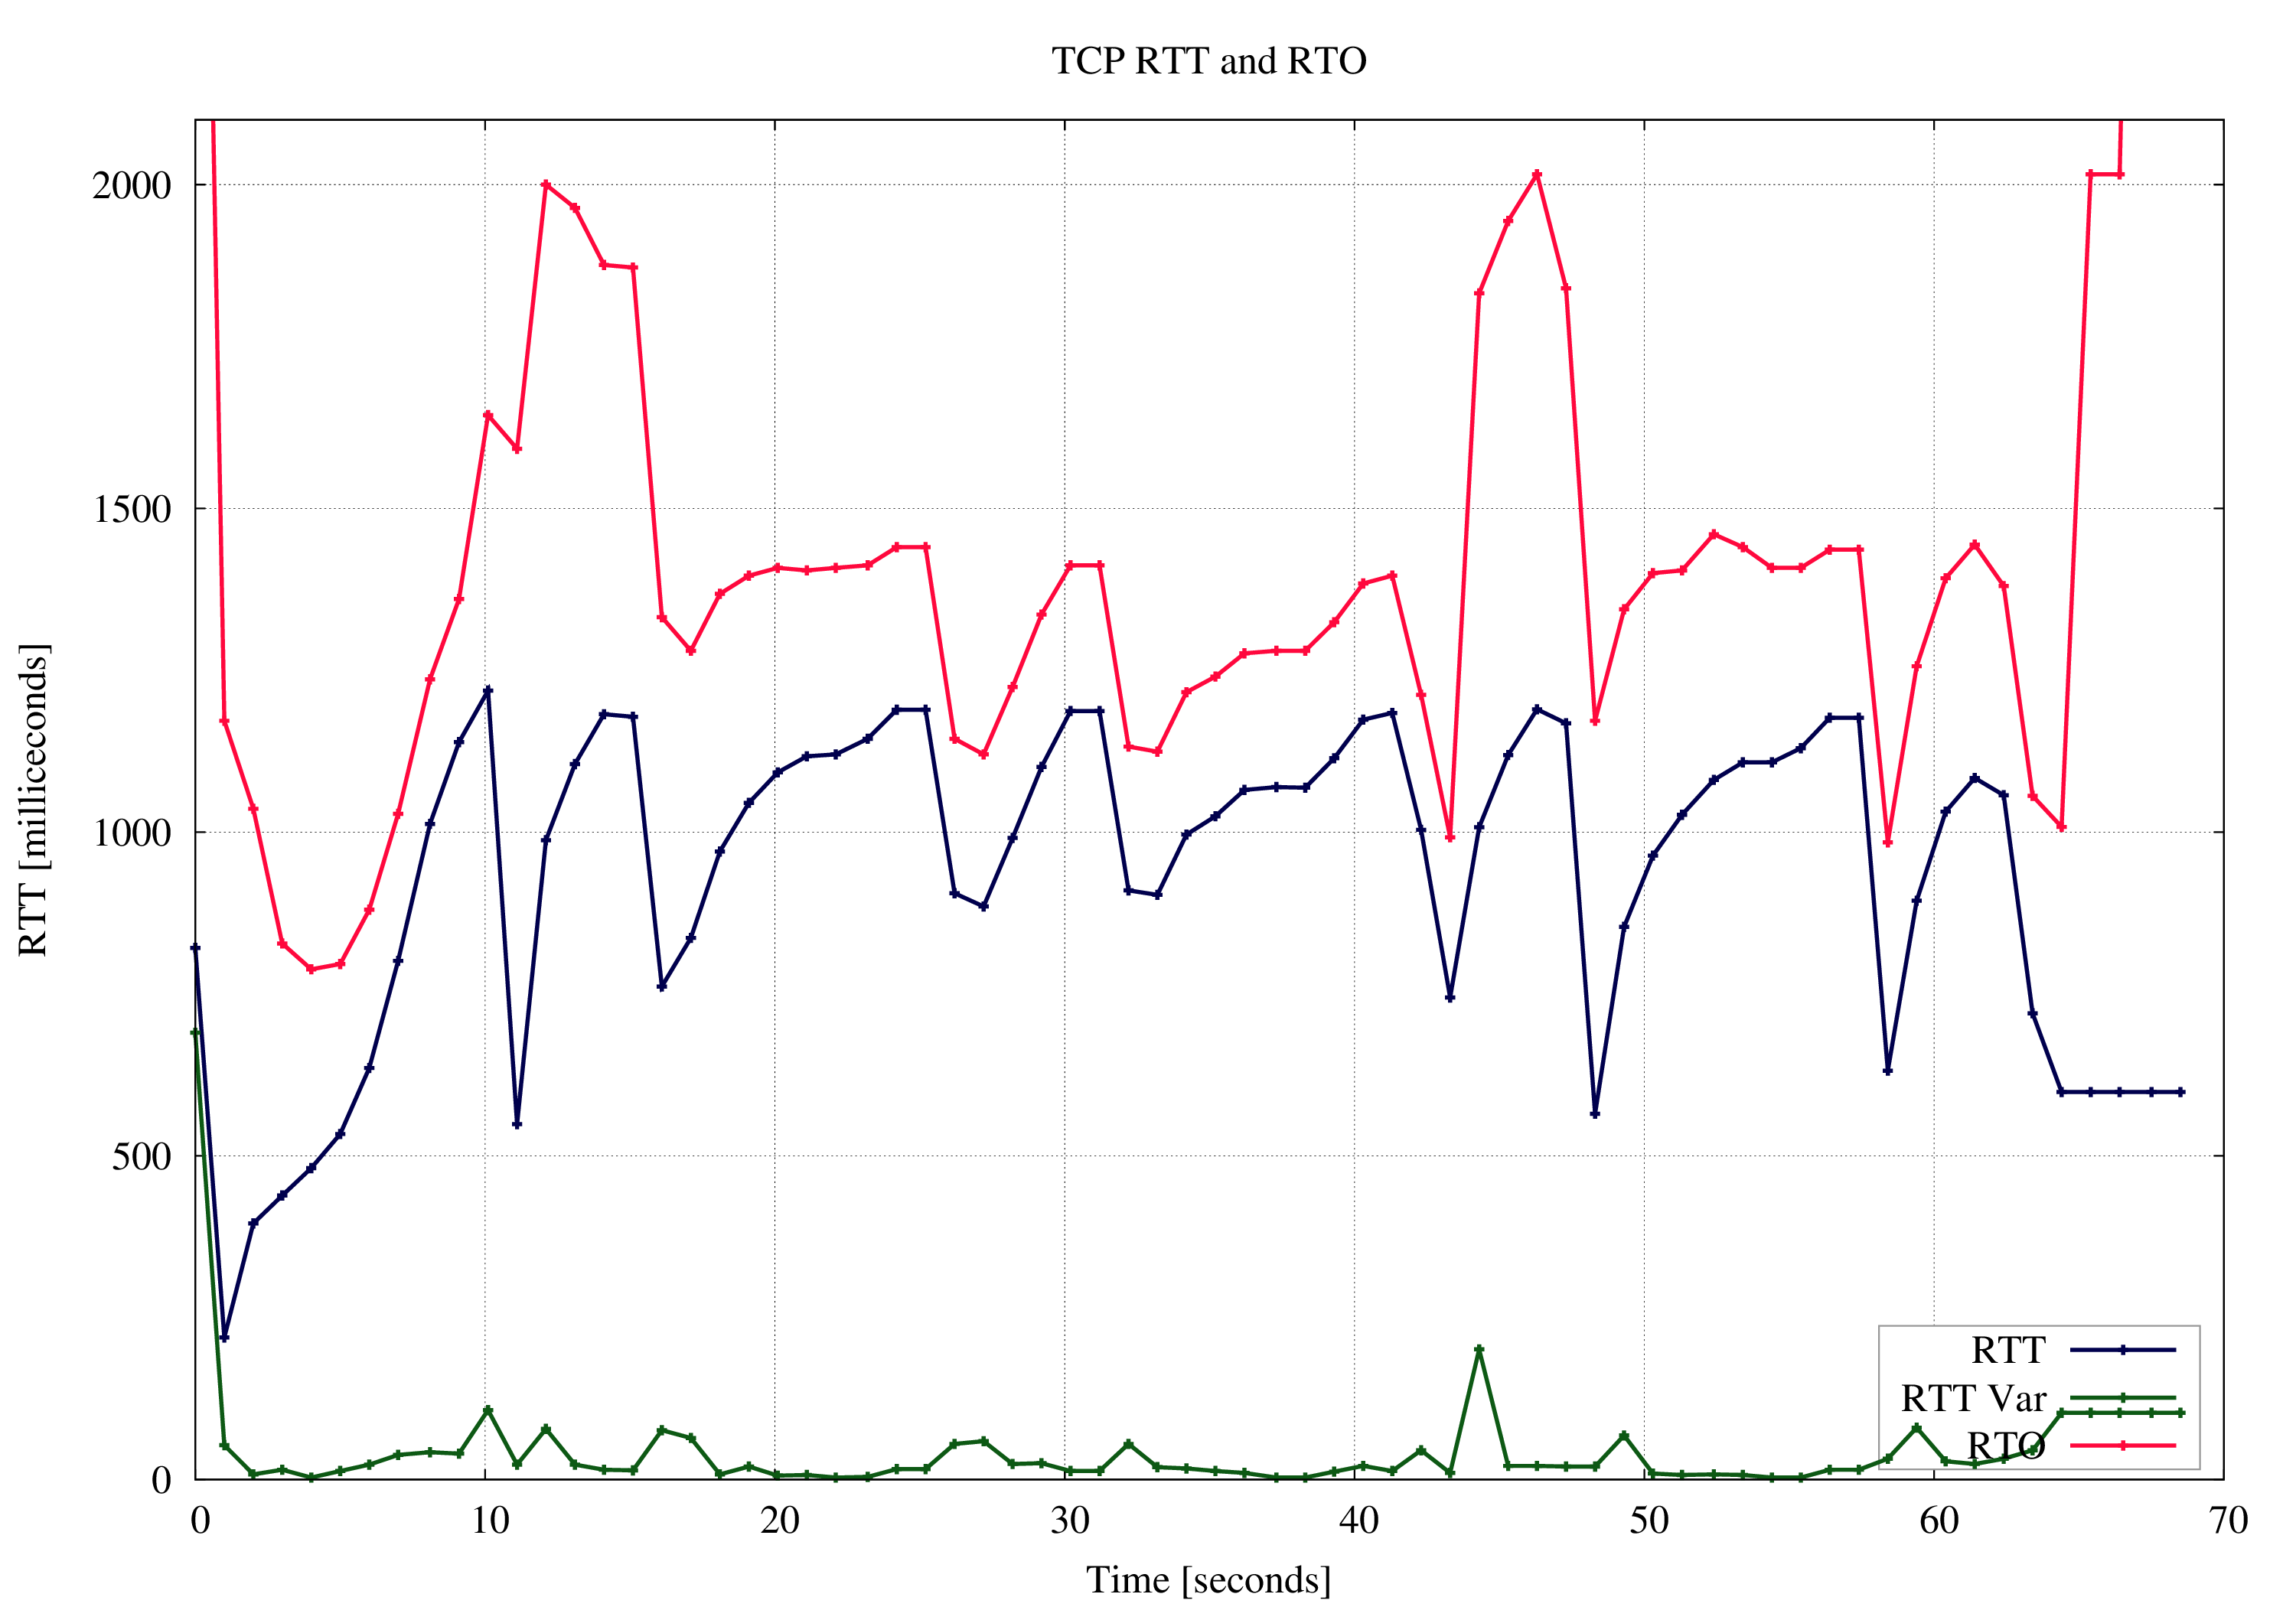
Round Trip Time and Rount Trip Timeout - RTT and RTO
Round trip time (RTT), round trip variation (RTT_VAR) and Rount Trip Timeout (RTO) for each connections are visualized with this graph.
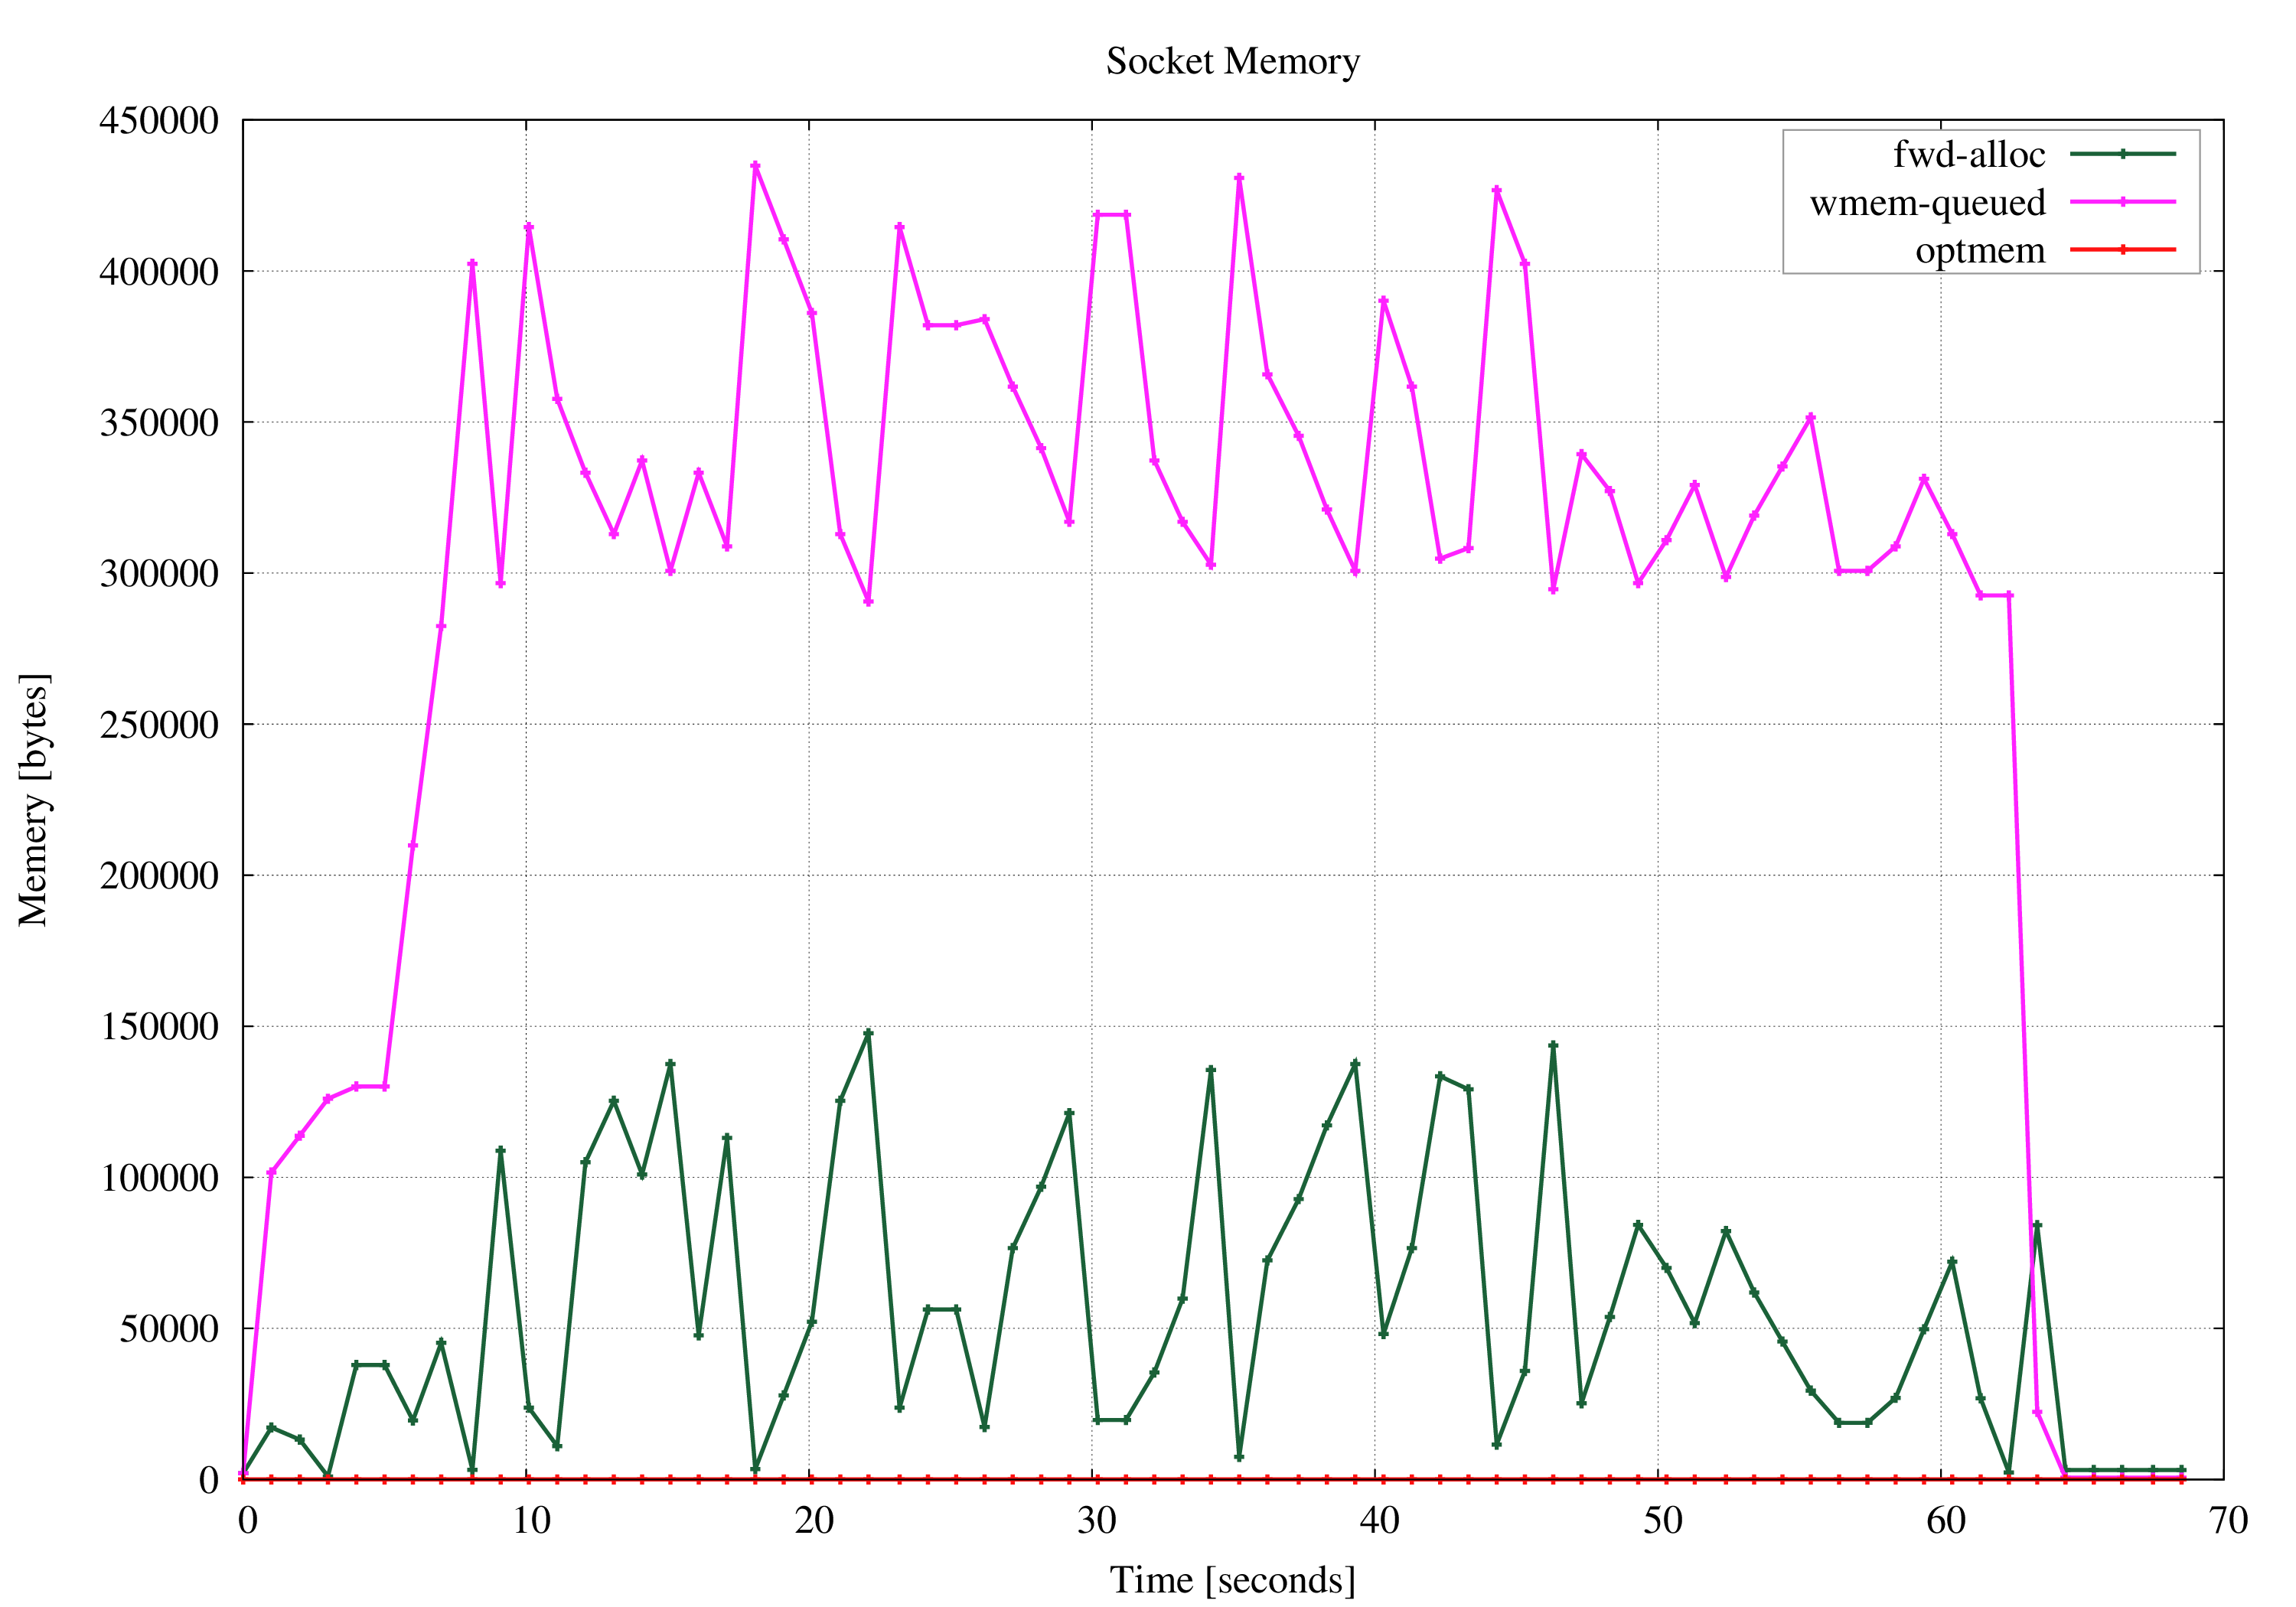
Socket Memory Information
Socket memory information can be visualized as well. What memory information is displayed depends on the Distribution used kernel and iproute version. Rule of thumb: newer kernels support more information. If you are lucky the following variables are visualized:
- SK_MEMINFO_RCVBUF
- SK_MEMINFO_SNDBUF
- SK_MEMINFO_BACKLOG
- SK_MEMINFO_RMEM_ALLOC
- SK_MEMINFO_WMEM_ALLOC
- SK_MEMINFO_FWD_ALLOC
- SK_MEMINFO_WMEM_QUEUED
- SK_MEMINFO_OPTMEM