Description
The spacing module visualize the time delta between packets and can be used to detect stalled connections. Use cases are where the TCP window is set to zero or where packet loss occur and a connection stall.
-f CONNECTIONS, --data-flow=CONNECTIONS
											specify the number of relevant ID's
-m MODE, --mode=MODE  display packets or bytes in flight (default packets)
-s, --stdio           don't create Gnuplot files, instead print to stdout
-i, --init            create Gnuplot template and Makefile in output-dir
-o OUTPUTDIR, --output-dir=OUTPUTDIR
											specify the output directory
-a SAMPLE_NO, --samples=SAMPLE_NO
											number of packet sampled (default: 10)
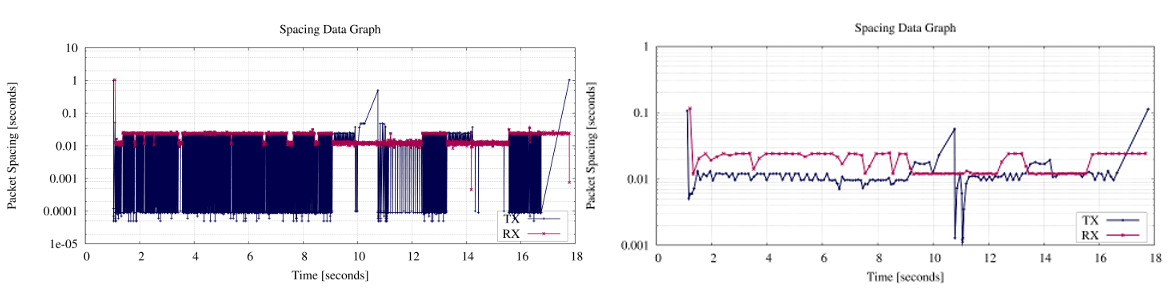
We start with a visualization of the famous TCP 20MB upload. But this time we change one parameter: the number of samples! On the left hand side you see a image where the sampling rate is 1, thus each packet delta to the previous packet is visualized. This amount of data is often to noise and hide the important characteristics. The right hand picture visualize the time between packets averaged over 10 packets. Values between 1 and 10 are a good choice. Please note that this time the Gnuplot file use a logarithmic scaled Y axis.
mkdir spacing-data
captcp spacing -f 1.1 -a 20 --init --output-dir spacing-data trace20mb.pcap
cd spacing-data
make pdf png