Description
TCP is a sliding window protocol, more then one packet can be
in transmit at a time. The inflight module seems similar to
the throughput module - but it isn't. Inflight must be called
with a valid connection ID, exact: a valid flow ID. The unique
inflight data is defined as the data send by sender and not
acknowledged. Duplicate send data is not accounted or
displayed. Therefore the connection ID is a required parameter
for inflight. The connection IDs can be displayed via
captcp statistic trace.pcap. Connection IDs are unique and don't
change. For the inflight analysis normally you will pick up
the data flow. If the connection is bidirectional you can
analyze both - of course. Lets assume we trace20.pcap has one
connection (1) and two flows (1.1 and 1.2), the data flow is
1.1 (this is where the 20MB are transmitted) and the ACK flow
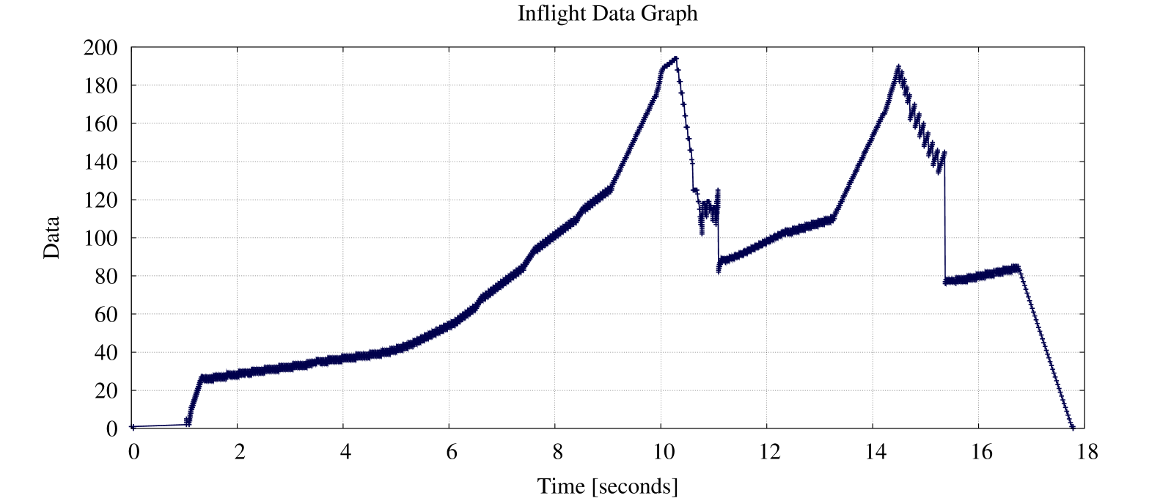
is 1.2. The Inflight module also has a stdio option. This can
be used to obtain a overview. We start with this option here
and the same 20MB upload PCAP trace.
$ captcp.py inflight -f 1.1 --stdio traces20.pcap
# connection: 1 (data flow: 1, ACK flow: 2)
0.00000 TX 1    #
0.04079 RX 0
0.04083 TX 1    #
1.04116 TX 2    ##
1.04128 TX 3    ###
1.04135 TX 4    ####
1.04141 TX 5    #####
1.09264 RX 2    ##
1.09266 TX 3    ###
1.09272 TX 4    ####
1.09277 TX 5    #####
1.10519 RX 4    ####
1.10522 TX 5    #####
1.10531 TX 6    ######
1.10540 TX 7    #######
1.11714 RX 6    ######
1.11716 TX 7    #######
1.11726 TX 8    ########
1.11735 TX 9    #########
1.12811 RX 8    ########
1.12814 TX 9    #########
1.12819 TX 10   ##########
1.12824 TX 11   ###########
1.14416 RX 10   ##########
1.14418 TX 11   ###########
1.14427 TX 12   ############
[...]
Each '#' represent a packet in flight. The output is cuted because the packet transfer is rather large. Therefore we switch to the graphical Gnuplot output.
Options
| Short option | Long option | Description |
|---|---|---|
| -o outputdir | --output-dir=outputdir | specify the output directory |
| -f connections | --data-flow=connections | specify the number of relevant id's |
| -m mode | -time=mode | display packets or bytes in flight |
| -i | --init | create gnuplot template and makefile in output-dir |
| -s | --stdio | don't create Gnuplot files, instead print to stdout |
Usage
The next illustration visualize the inflight behavior for four different TCP Congestion Control algorithmen: CUBIC, Vegas, Westwood and NewReno. 10MB (10^6) are uploaded for the measurement. Elapsed time for each transfer are really similar: 01:37.19 for Cubic, 01:36.14 for NewReno, 01:36.29 for Vegas and 01:37.65 for Westwood. Thus the throughput is somewhere between 102404 Bps (Westwood) and 104011 Bps for NewReno.
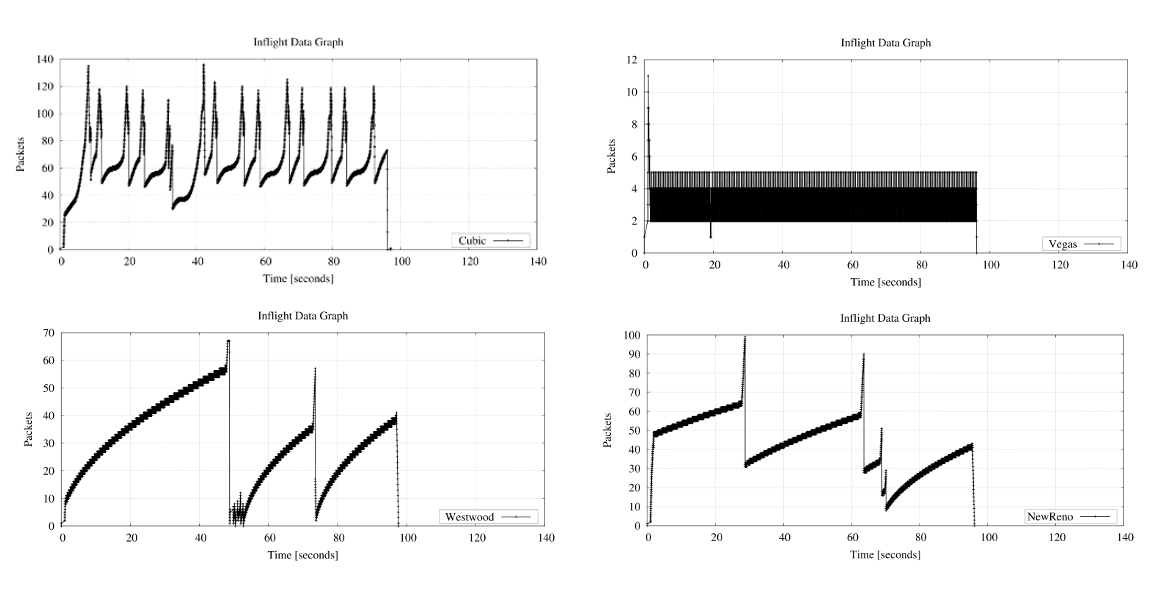
By the way: the inflight module functionality is called "Outstanding Data Graph" in TCPTrace.