Description
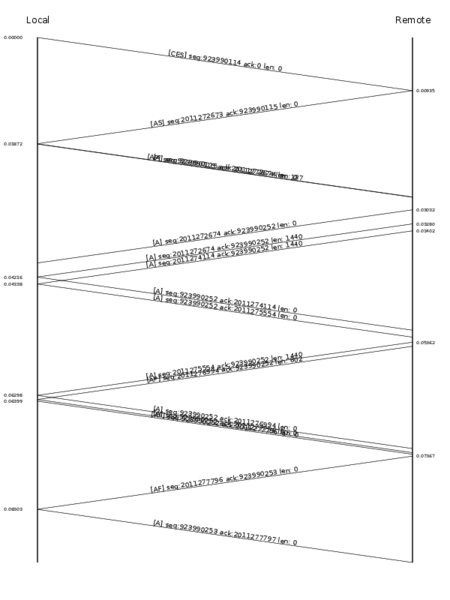
Visualize data flow from sender to receiver and back. focus on packet delay and wait times during connection. this image may provide a high level aspects where a connections "stalls" and where not. it further provide another view of how slow start is working and the current congestion window.
options
	-v loglevel, --loglevel=loglevel
												set the loglevel (info, debug, warning, error)
	-l localaddr, --local=localaddr
												specify list of local ip addresses
	-s size, --size=size  specify the size of the image (default: 600x1200)
	-r rtt, --rtt=rtt     specify the average rtt per connection (default 0.025s)
	-f filename, --filename=filename
												specify the name of the generated pdf file (default: sequence.pdf)
	-i connections, --connection-id=connections
												specify the number of relevant id's
	-y style, --style=style
												specify the style of the labels (normal or minimal)
	-p locallabel, --locallabel=locallabel
												the default string left axis (default: local)
	-q remotelabel, --remotelabel=remotelabel
												the default string right axis (default: remote)
usage
$ captcp sequencegraph --rtt 0.0187 --style minimal --local 192.168.1.38 --size 600x800 trace-one-http-session.pcap
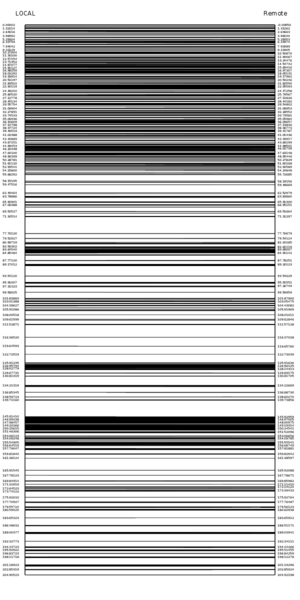
the next illustation provides another nice visualization of data. not the pure amount of data can be seen, rather a nice feeling of how many packets are transmitted and received at a given time.