Perf Studio – Details
Overview
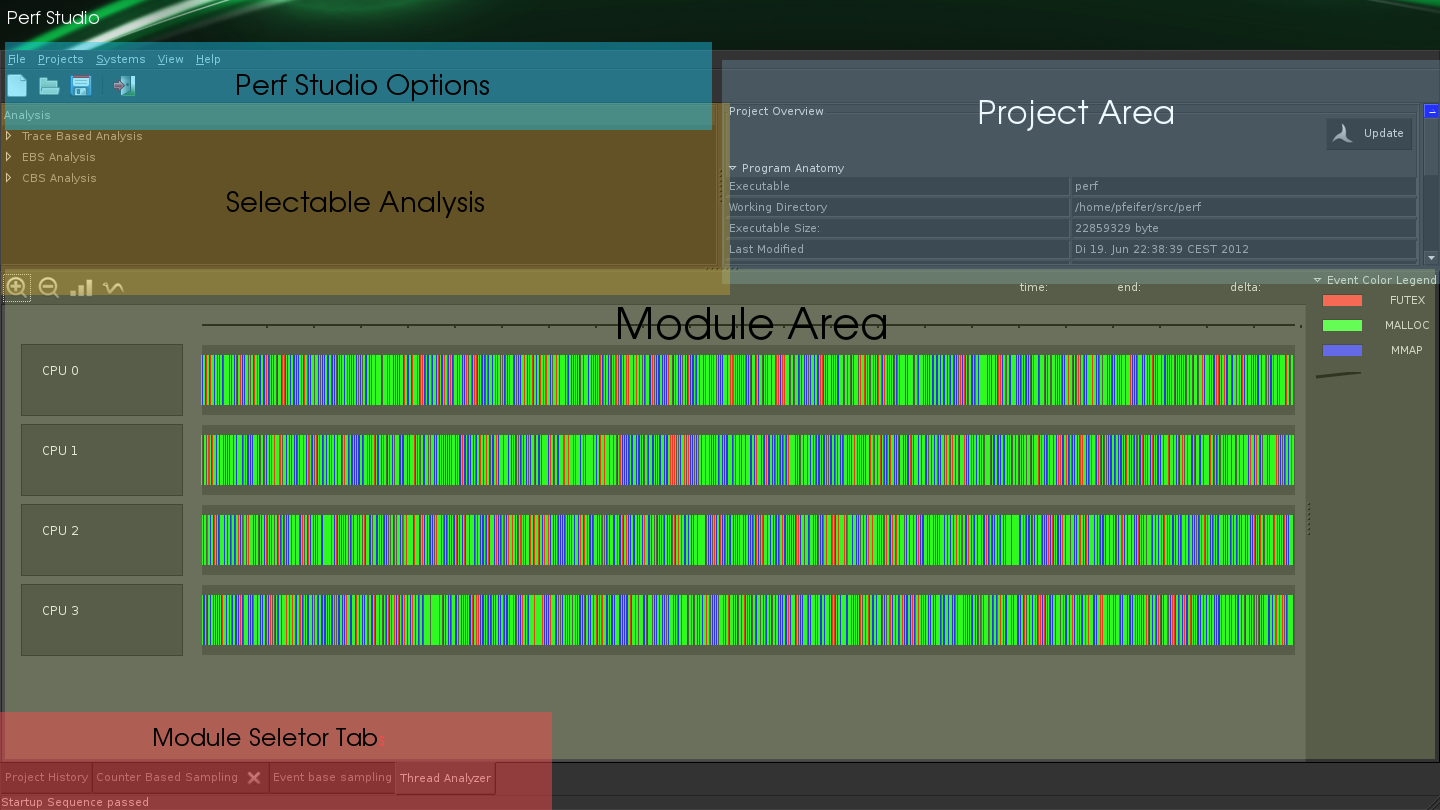
GUI Elements and Operation Concept
Perf Studio GUI is splitted in several areas. In the upper area is the control panel. The control panel is static in the behavior. The lower half of the window is the module panel. It show information based on the currently active analysis module. The control panel is splitted in two sub panels. The left hand side module control panel and the right hand side project control panel. The module control panel listed all available analysis modules. It additionally shows if a analysis is up-to-date or outdated (because the executable is more newer). Furthermore it shows on a per module basis if a analysis type is suggested. The status can be suggested or neutral (because the underlying data is not sufficient). A double-click on the analysis module opens a new window in the module panel.
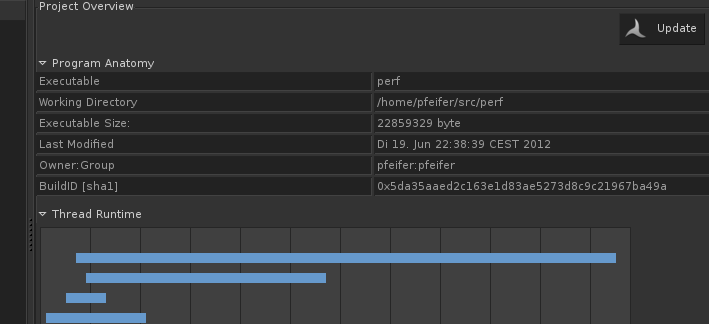
The project control panel on the upper right side provides information about the current projects like
- Path to executable
- Working directory
- Scheduling Policy
- ...
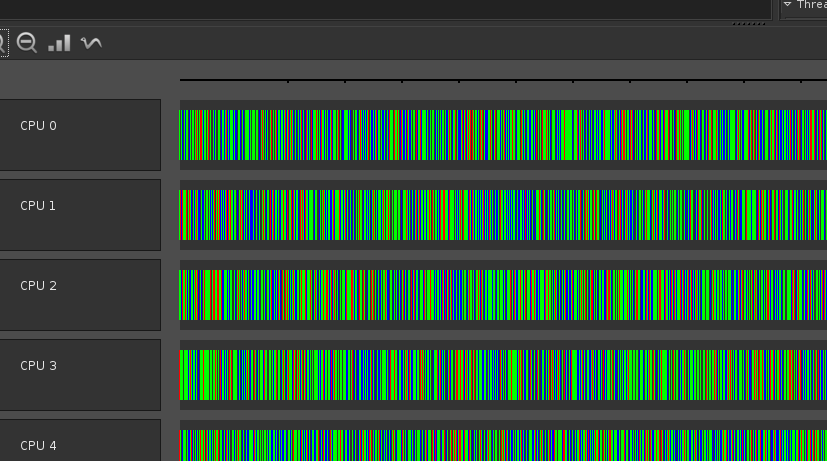
The content of the module panel can be quite complex. Depending on the particular analysis module and the need to show complex correlations the panel can be full of information. Other analysis modules like the hotspot analyzer will basically show a encriched text editor window.
Common for all module panels is the first row of data. In the left hand side the name of the module is displayed. On the right hand side a run button provides functionality to run or rerun an analysis. Right from the run button the preference button is displayed. Pushing this button pops-up a module specific preferences module. Right from the preference button a help button is arranged. Pushing this button opens a help window displaying further information about the particular analysis module.
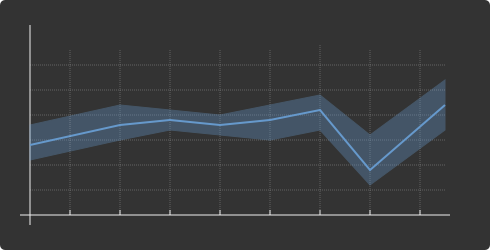
One module is special: it is the history module. The history module provide information over time.
Perf Studio Modules
Module List
- Thread Contention Analyser
History Database
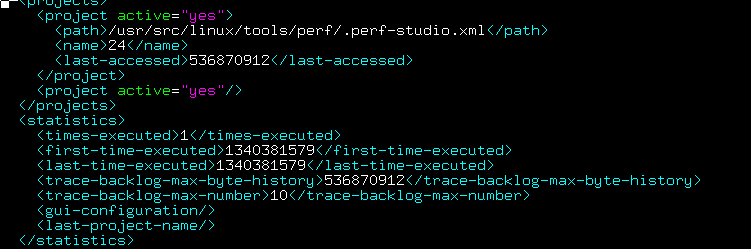
All project data and performance history data is saved in a database. This database provides information how optimization take affect.
The database if no propritary format or even binary. Reading this data is not performance critical. Thus the data is stored in pure XML.
History Database
The database if no propritary format or even binary. Reading this data is not performance critical. Thus the data is stored in pure XML.
History Database
The database if no propritary format or even binary. Reading this data is not performance critical. Thus the data is stored in pure XML.
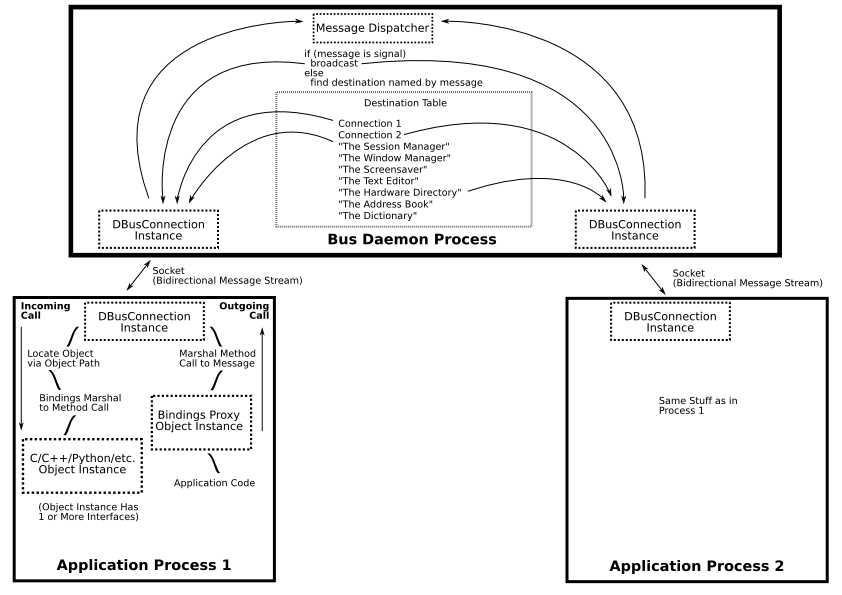
Automated Analyis
Performance analysis can be time consuming and a lot of involved parameters are to be considered. To automate the process Perf Studio provides a easy and straight forward mechanism to automate analysis! Via DBUS (inter-process communication framework) Perf Studio can be instrumented. A small Perf Studio Control client is included to start analysis. This client can be integrated into a Makefile or shell scripts.
Example one: test different compileflags
for i in cflags:
	make clean
	make CFLAGS=$i
	dbus-send-message org.perf-studio do-test $(pwd)
	# block until test returns
	dbus-recv-message org.perf-studio
Example two: change OS knobs
for i in mm-opts:
	echo $i > /proc/sys/mm/
	dbus-send-message org.perf-studio do-test $(pwd)
	# block until test returns
	dbus-recv-message org.perf-studio
http://www.ibm.com/developerworks/linux/library/l-dbus/index.html