Time Sequence Grapher
Python Library to Visualize Time Periods and Correlations
During one of my project to spot performance problems (caused by pthread lock contentions) I looked for libraries to visualize time relations. I searched for an easy API (no matter what scripting language) to visualize something which look like a Gantt Diagram. At the end: no tool/library was suitable.
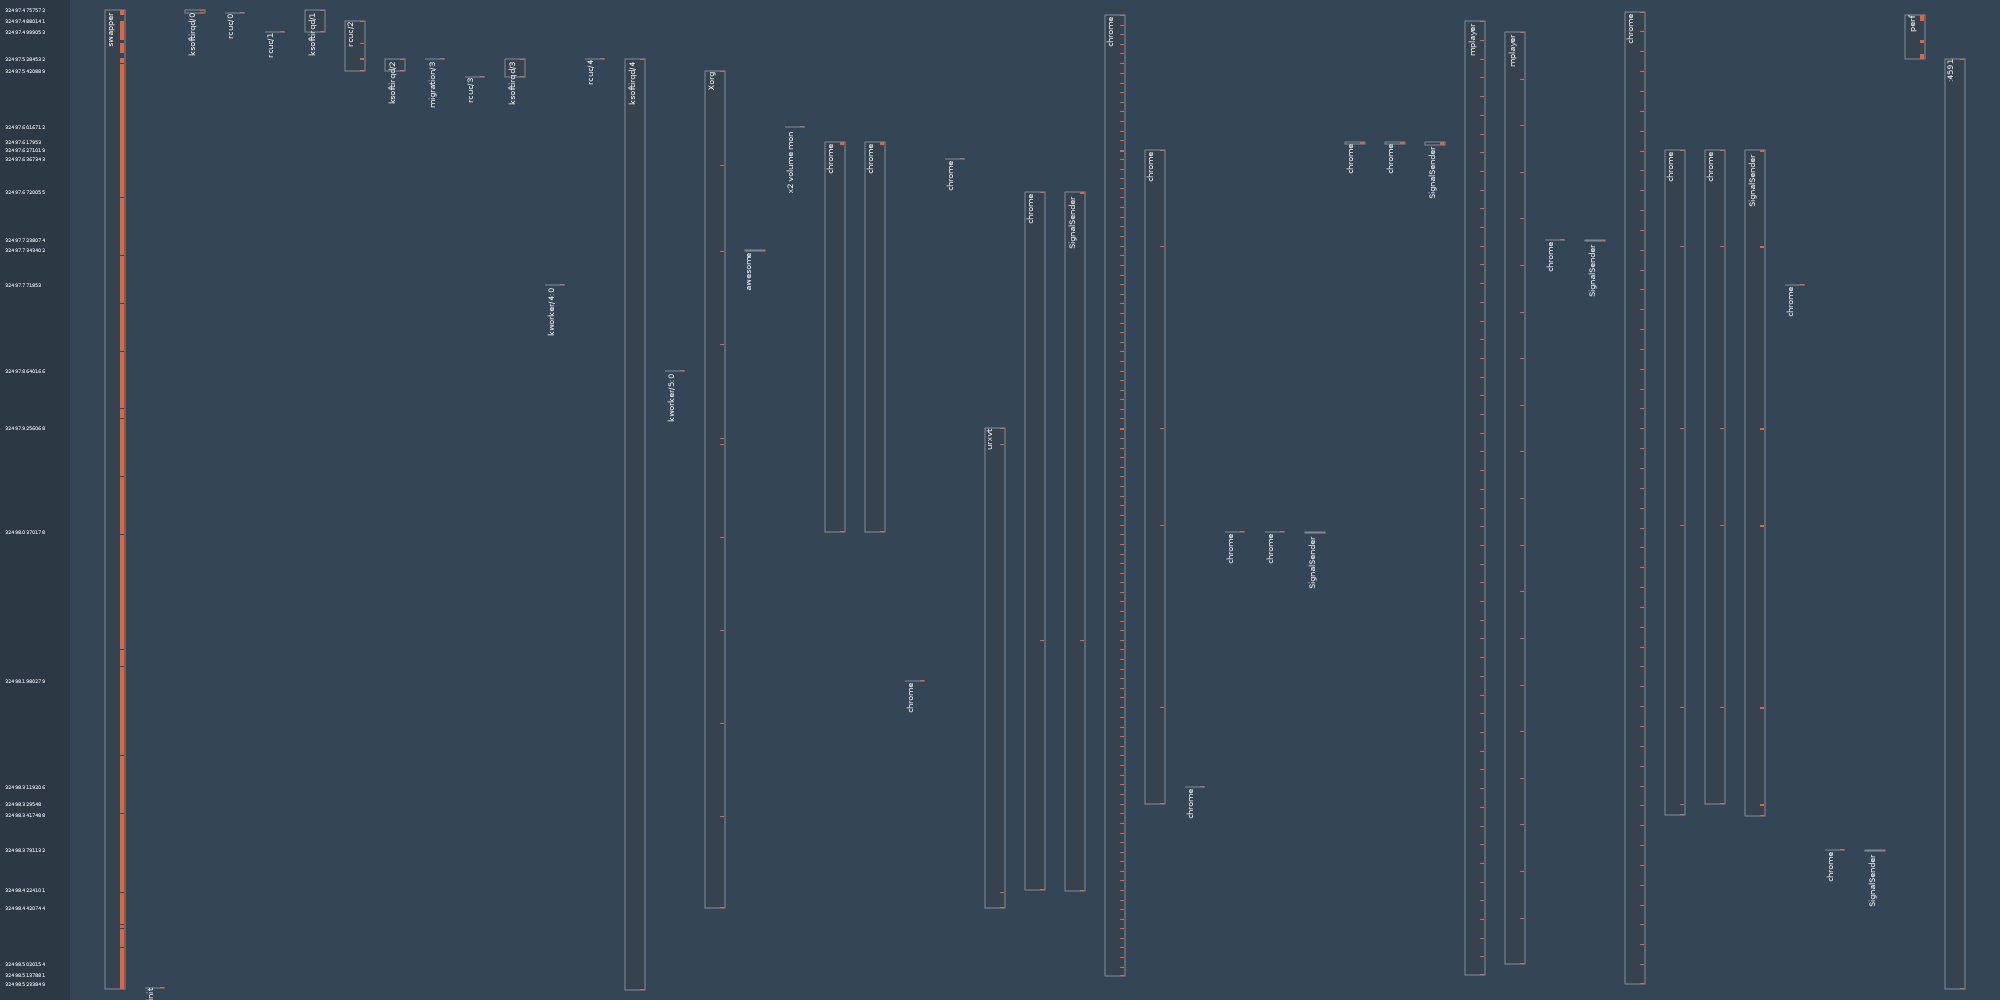
This small library use the Cairo library and generate PDF files. Major API design requirement was simplicity. The following image illustrate one result:
Usage
Color Scheme - Theming
Currently only this dark scheme is supported. But the code can easily extended to use your own customized style.
Example
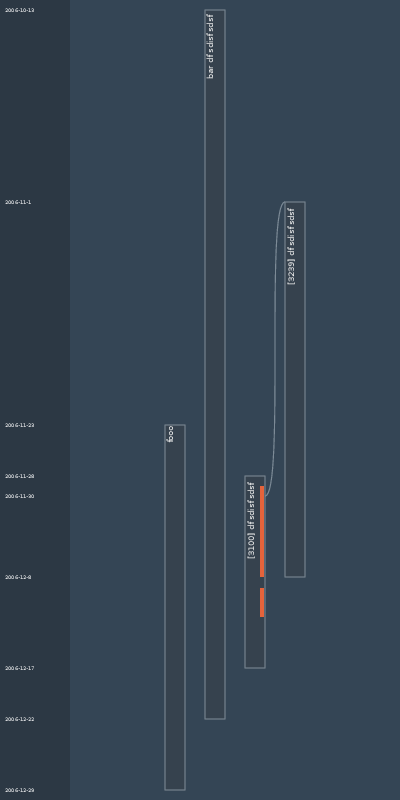
Code say more then thousand words. So here is a small example where we generate a PDF file with a height of 800 pixel x 600 pixel in width. We generate 4 timelines and in one timeline we create 2 so called sub-timeline to visualize something within a timeline. Last step is to draw a connector between two timelines (a and b) with two specific dates.
The constructor is called with a UNIT argument. Currently there is support for scalar values like float or plain integer and there is support for Python datetime objects.
from sequencegrapher import *

tsd = SequenceGrapher(unit=SequenceGrapher.UNIT_DATETIME, output="graph.pdf")

tsd.height = 800
tsd.width  = 600

tsd.create_timeline(datetime.datetime(2006, 11, 23, 16, 30),
                    datetime.datetime(2006, 12, 29, 14, 31),
                    label="fooo")

tsd.create_timeline(datetime.datetime(2006, 10, 13, 16, 30),
                    datetime.datetime(2006, 12, 22, 14, 31),
                    label="bar df sdisf sdsf")


a = tsd.create_timeline(datetime.datetime(2006, 11, 28, 16, 30),
                        datetime.datetime(2006, 12, 17, 14, 31),
                        label="[3100] df sdisf sdsf")


tsd.create_sub_timeline(a,
                        datetime.datetime(2006, 11, 29, 16, 30),
                        datetime.datetime(2006, 12, 8, 14, 31))

tsd.create_sub_timeline(a,
                        datetime.datetime(2006, 12, 9, 16, 30),
                        datetime.datetime(2006, 12, 12, 14, 31))


b = tsd.create_timeline(datetime.datetime(2006, 11, 01, 16, 30),
                        datetime.datetime(2006, 12, 8, 14, 31),
                        label="[3239] df sdisf sdsf")

tsd.create_connector(a,
                     b,
                     time1=datetime.datetime(2006, 11, 30, 16, 30),
                     time2=datetime.datetime(2006, 11, 01, 16, 30))

tsd.draw()
The generated output (graph.pdf) look like the following image:
Misc
Currently only PDF files can be generated. PNG file support is just
not interesting for me. To generate PNG files I simple use a third
party tool: image magick: convert file.pdf file.png to
convert from PDF to PNG.