Plottr
Gnuplot Data Visualizer
Visualize 2D and 3D data using directory information. During data
generation the x and y axis must be "saved" as directory
names and Plottr will use this information. The only thing
to do at data generation time is something like
mkdir x-N and within this directory something like
mkdir y-N. Within this leaf directory the actual data
must be stored as plain ASCII files, ending with ".data".
The last thing is to run plottr in the root directory.
The advantage over other schemes is that the direcories can be used for immediate data processing during data generation. Another advantage is directory data separation, suitable to parallelize analysis. E.g. each CPU/Host/Cluster generate a subset of data. At the end the only process is to pull the required data via rsync to the local machine. No need to do a ASCII, binary file merge or whatever.
Usage
Provide a 3D able data structure, similar to this structure:
.
|-- subfunctions-00020
|   |-- instructionsize-00030
|   |   |-- iTLB-load-misses.data
|   |   `-- LLC-loads.data
|   |-- instructionsize-00050
|   |   |-- iTLB-load-misses.data
|   |   `-- LLC-loads.data
|   `-- instructionsize-00070
|       |-- iTLB-load-misses.data
|       `-- LLC-loads.data
|
|-- subfunctions-00030
|   |-- instructionsize-00030
|   |   |-- iTLB-load-misses.data
|   |   `-- LLC-loads.data
|   |-- instructionsize-00050
|   |   |-- iTLB-load-misses.data
|   |   `-- LLC-loads.data
|   `-- instructionsize-00070
|       |-- iTLB-load-misses.data
|       `-- LLC-loads.data
|
|-- subfunctions-00040
|   |-- instructionsize-00030
|   |   |-- iTLB-load-misses.data
|   |   `-- LLC-loads.data
|   |-- instructionsize-00050
|   |   |-- iTLB-load-misses.data
|   |   `-- LLC-loads.data
|   `-- instructionsize-00070
|       |-- iTLB-load-misses.data
|       `-- LLC-loads.data
[...]
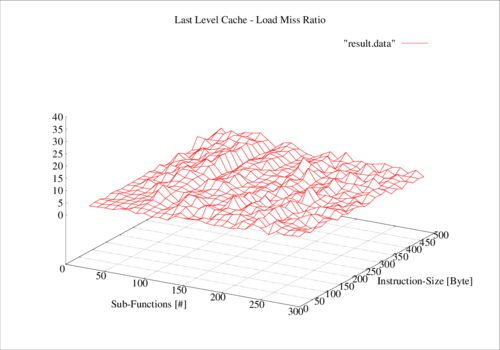
Now generate Gnuplot data files, Gnuplot template and PDF/PNG image.
# generate Gnuplot template and data file
plottr --data-name iTLB-load-misses.data

# generate PDF
make

# convert PDF to PNG raster image
make png
Download
Via Github: https://github.com/hgn/Plottr